Multifunctional data managemenet platform
![]() Platform features
Platform features ![]()
Advantages
Cubisio allows you to organize a full cycle of data processing, from extracting data from external sources to building your own analytical system
All in one: working with sources, building models, scheduled ETL processes, designing dashboards, ontologies and input forms, etc.
Tools are designed as visual editors, implementing a no-code approach
The main modules and components of the Cubisio visual analytics platform are proprietary and can be seamlessly integrated into third-party solutions.
![]() Analogues
Analogues ![]()
Main directions and products
replaced by our system
Cubisio is a complete business intelligence system.
The process begins with the formation of a data model (a cube is a key element that allows you to combine several sources into a single multidimensional data model) and the creation of related structures through the formation of ontological chains.
And it ends with the formation of visual widgets that are customizable to the user's individual design (the system offers ample opportunities for visualizing data and processing results, including graphs, maps, timelines, interactive drill-down reports with charts, graphs and diagrams).
Cubisio is equipped with a built-in visual designer of automation schemes for managing data collection and processing processes.
The design of the data processing algorithm is carried out by dragging functional blocks from the library into the workspace without the need for coding.
Cubisio allows you to work simultaneously with data from many different sources by connecting to data sources on the fly. List of supported DBMS (Oracle, Microsoft SQL Server, PostgreSQL, Postegres Pro, MySQL, etc.).
One of the main strengths of the Cubisio platform is the ability to work as an "analytical core".
The system can receive data from various data sources, carry out the necessary analysis (if necessary, with the capabilities of artificial intelligence elements) and return the user the results he needs by means of data exchange through the built-in API.
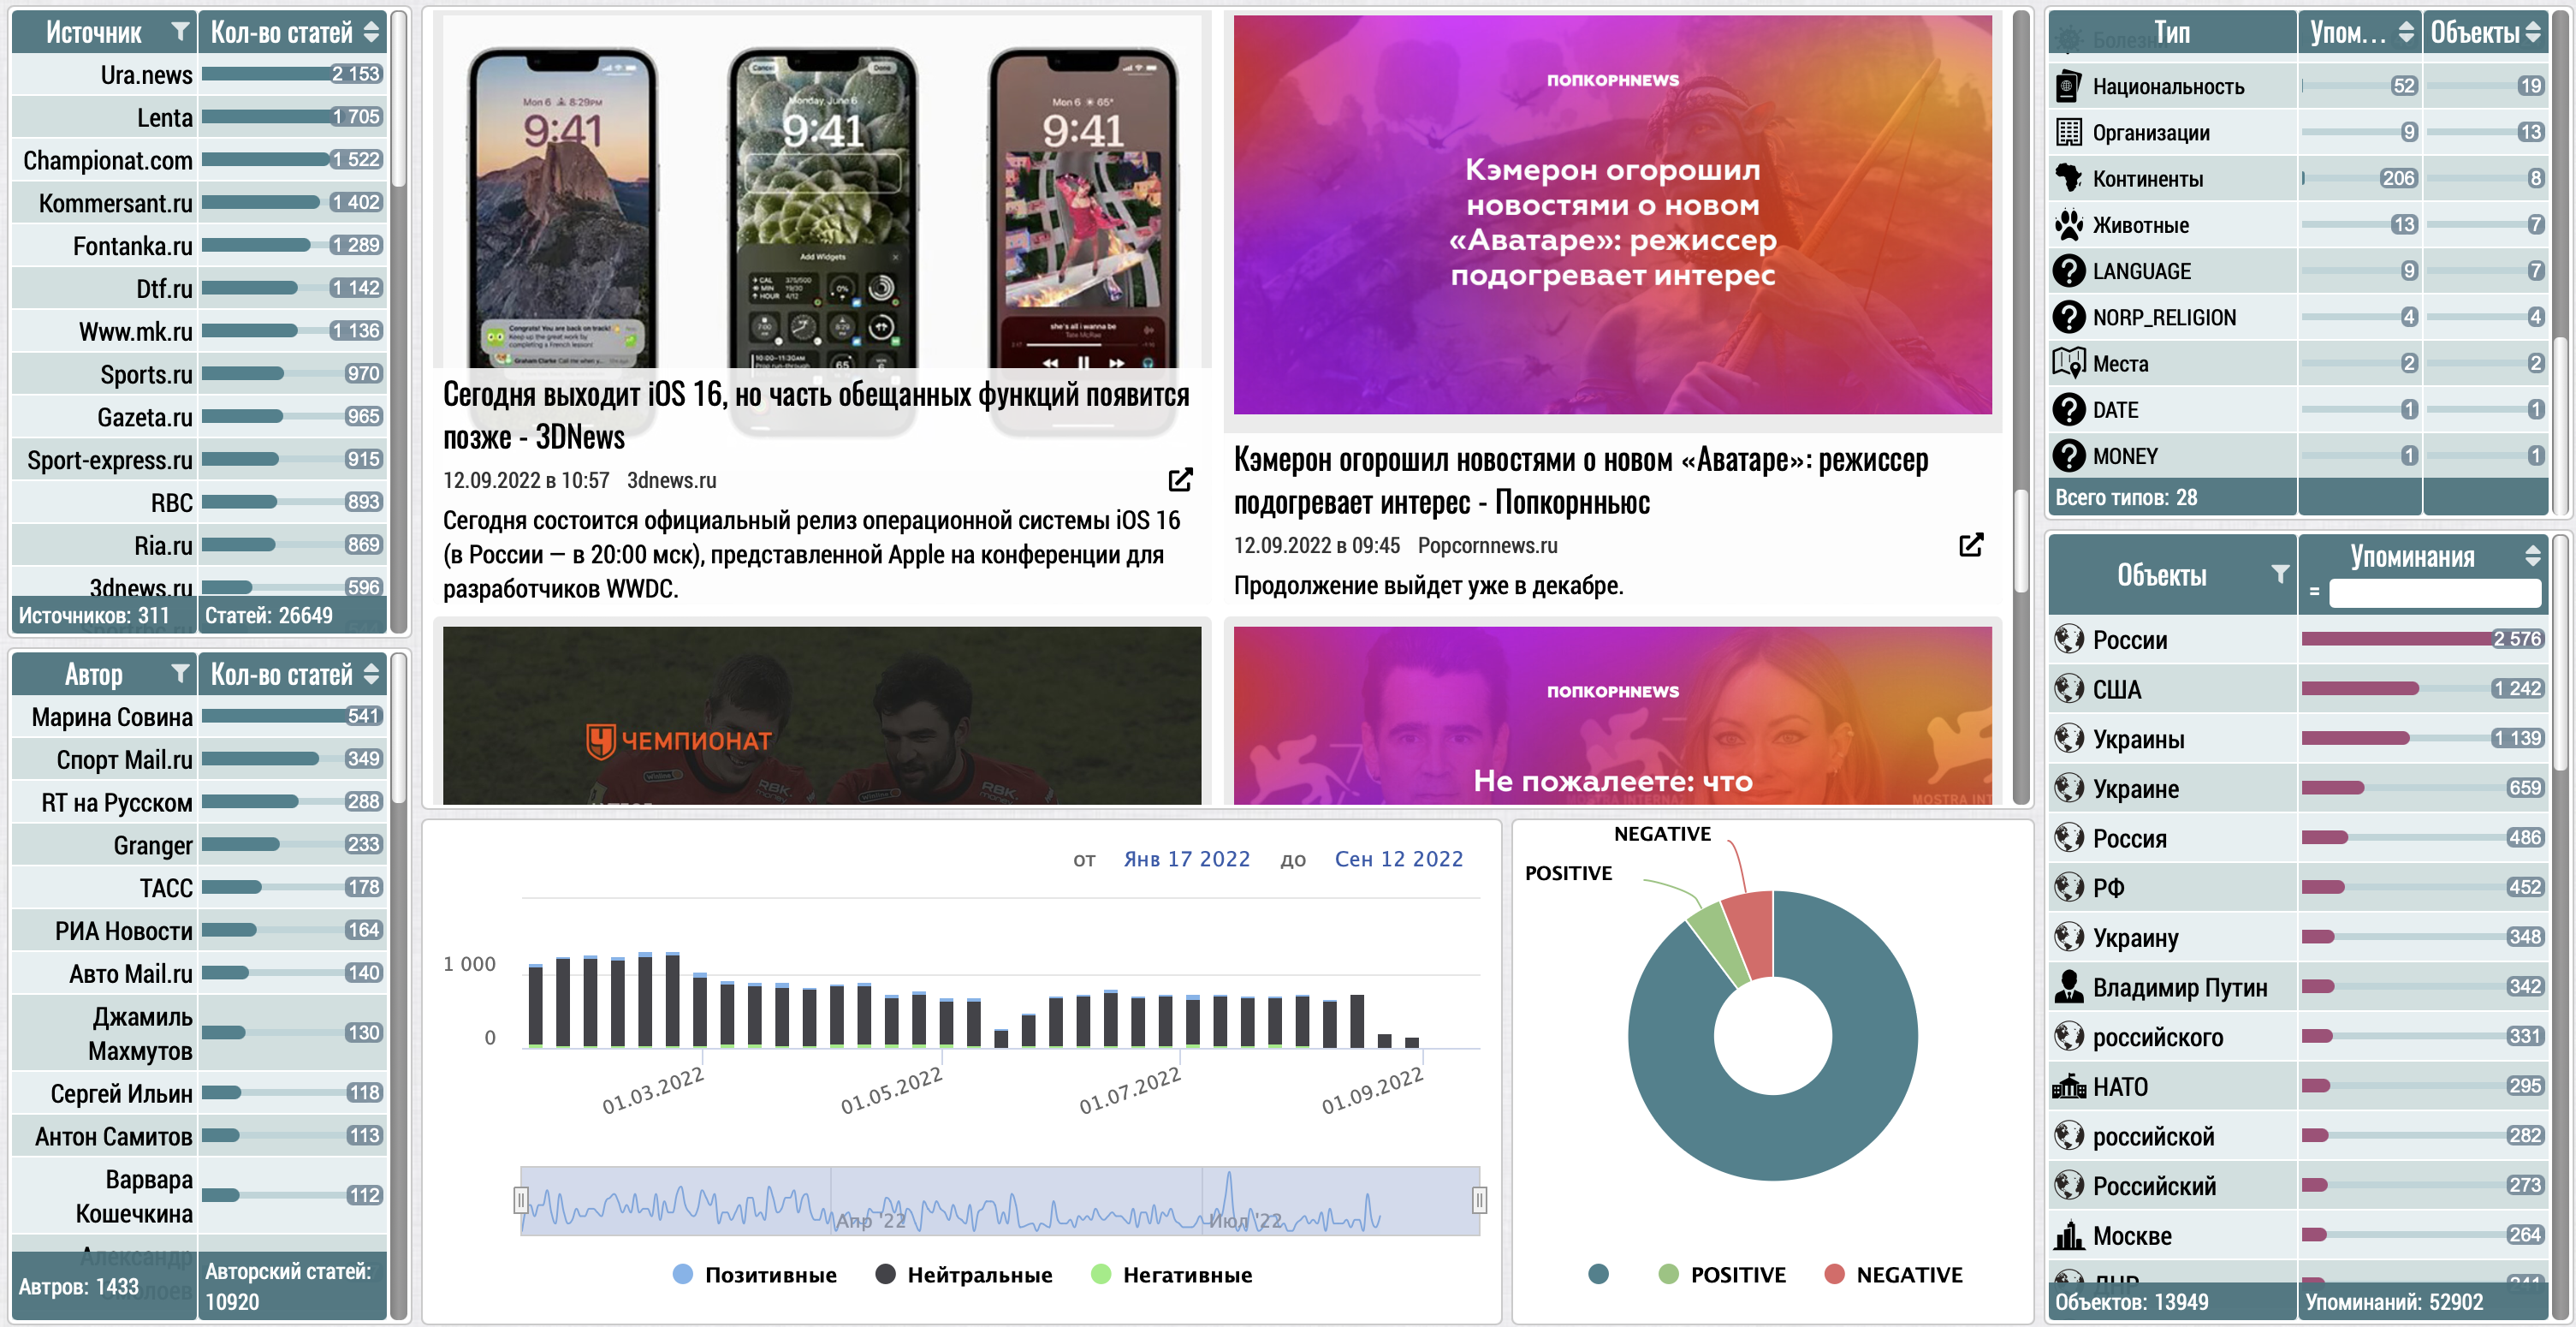
![]() Data visualization
Data visualization ![]()
Dashboard examples
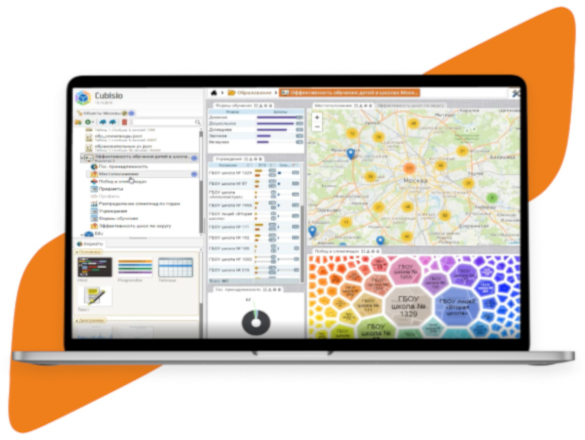
Efficiency of teaching in Moscow schools
Comparison of Moscow schools according to the results of the Unified State Examination and Olympiads
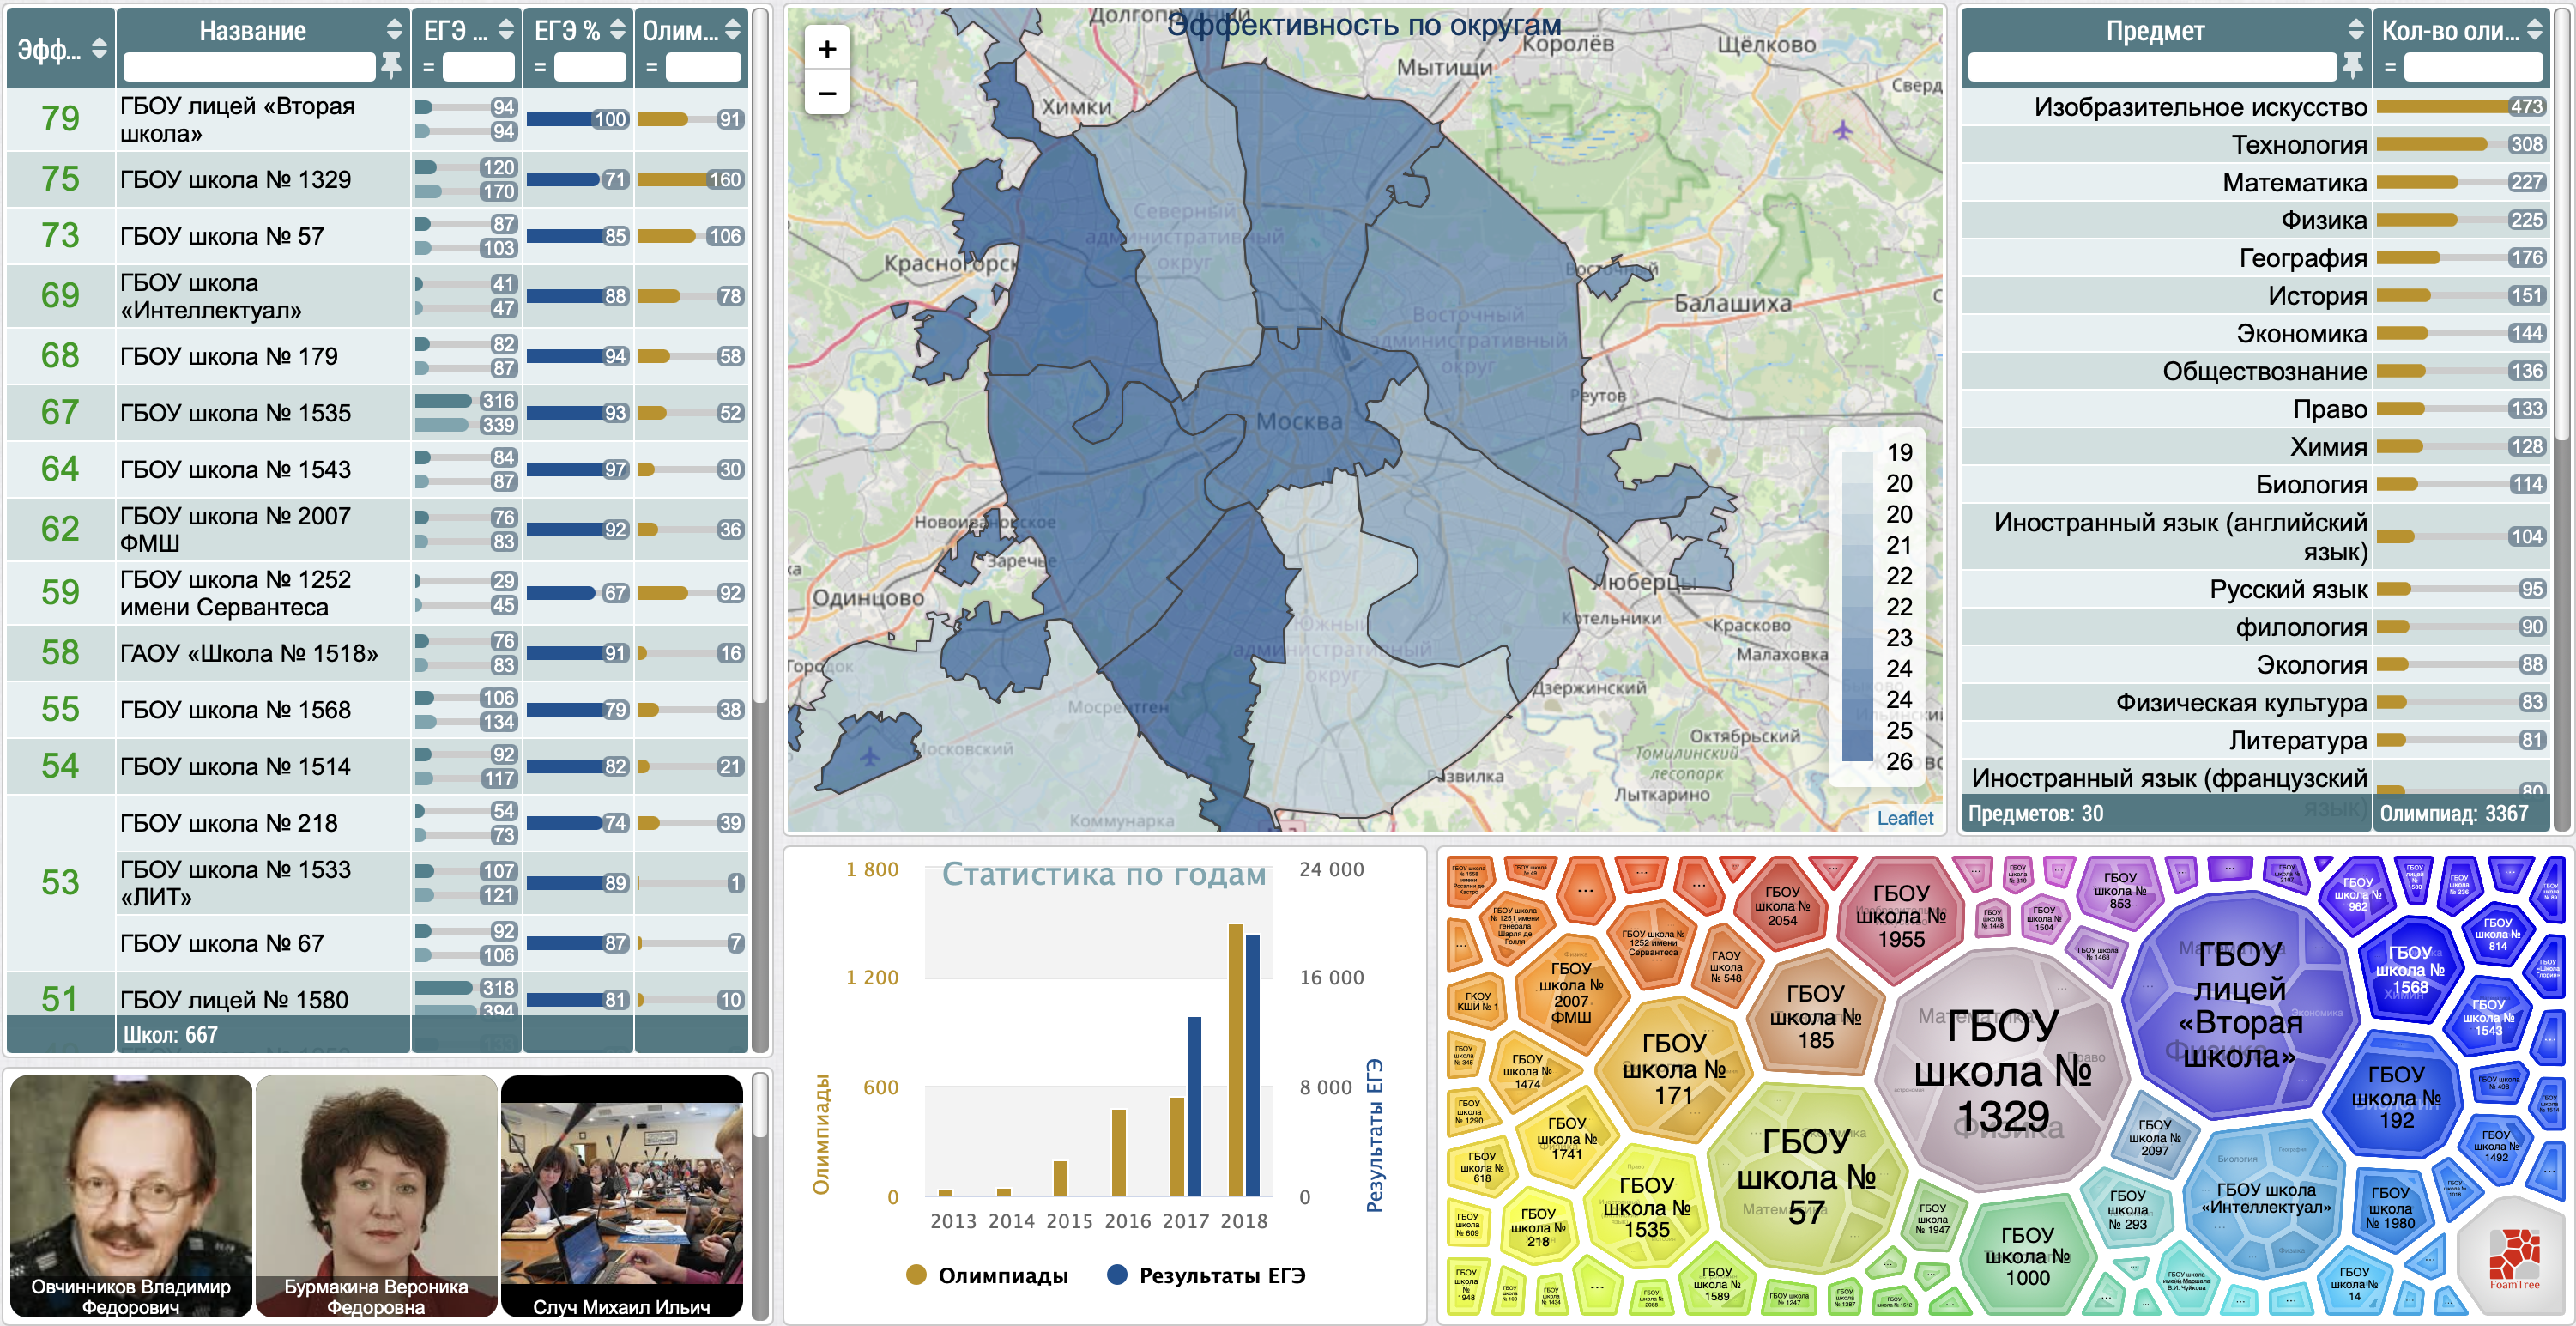
MoreBI-radar
The study of the domestic BI platform market is presented on the dashboard, which provides an up-to-date snapshot of BI analyst vacancies on HeadHunter
More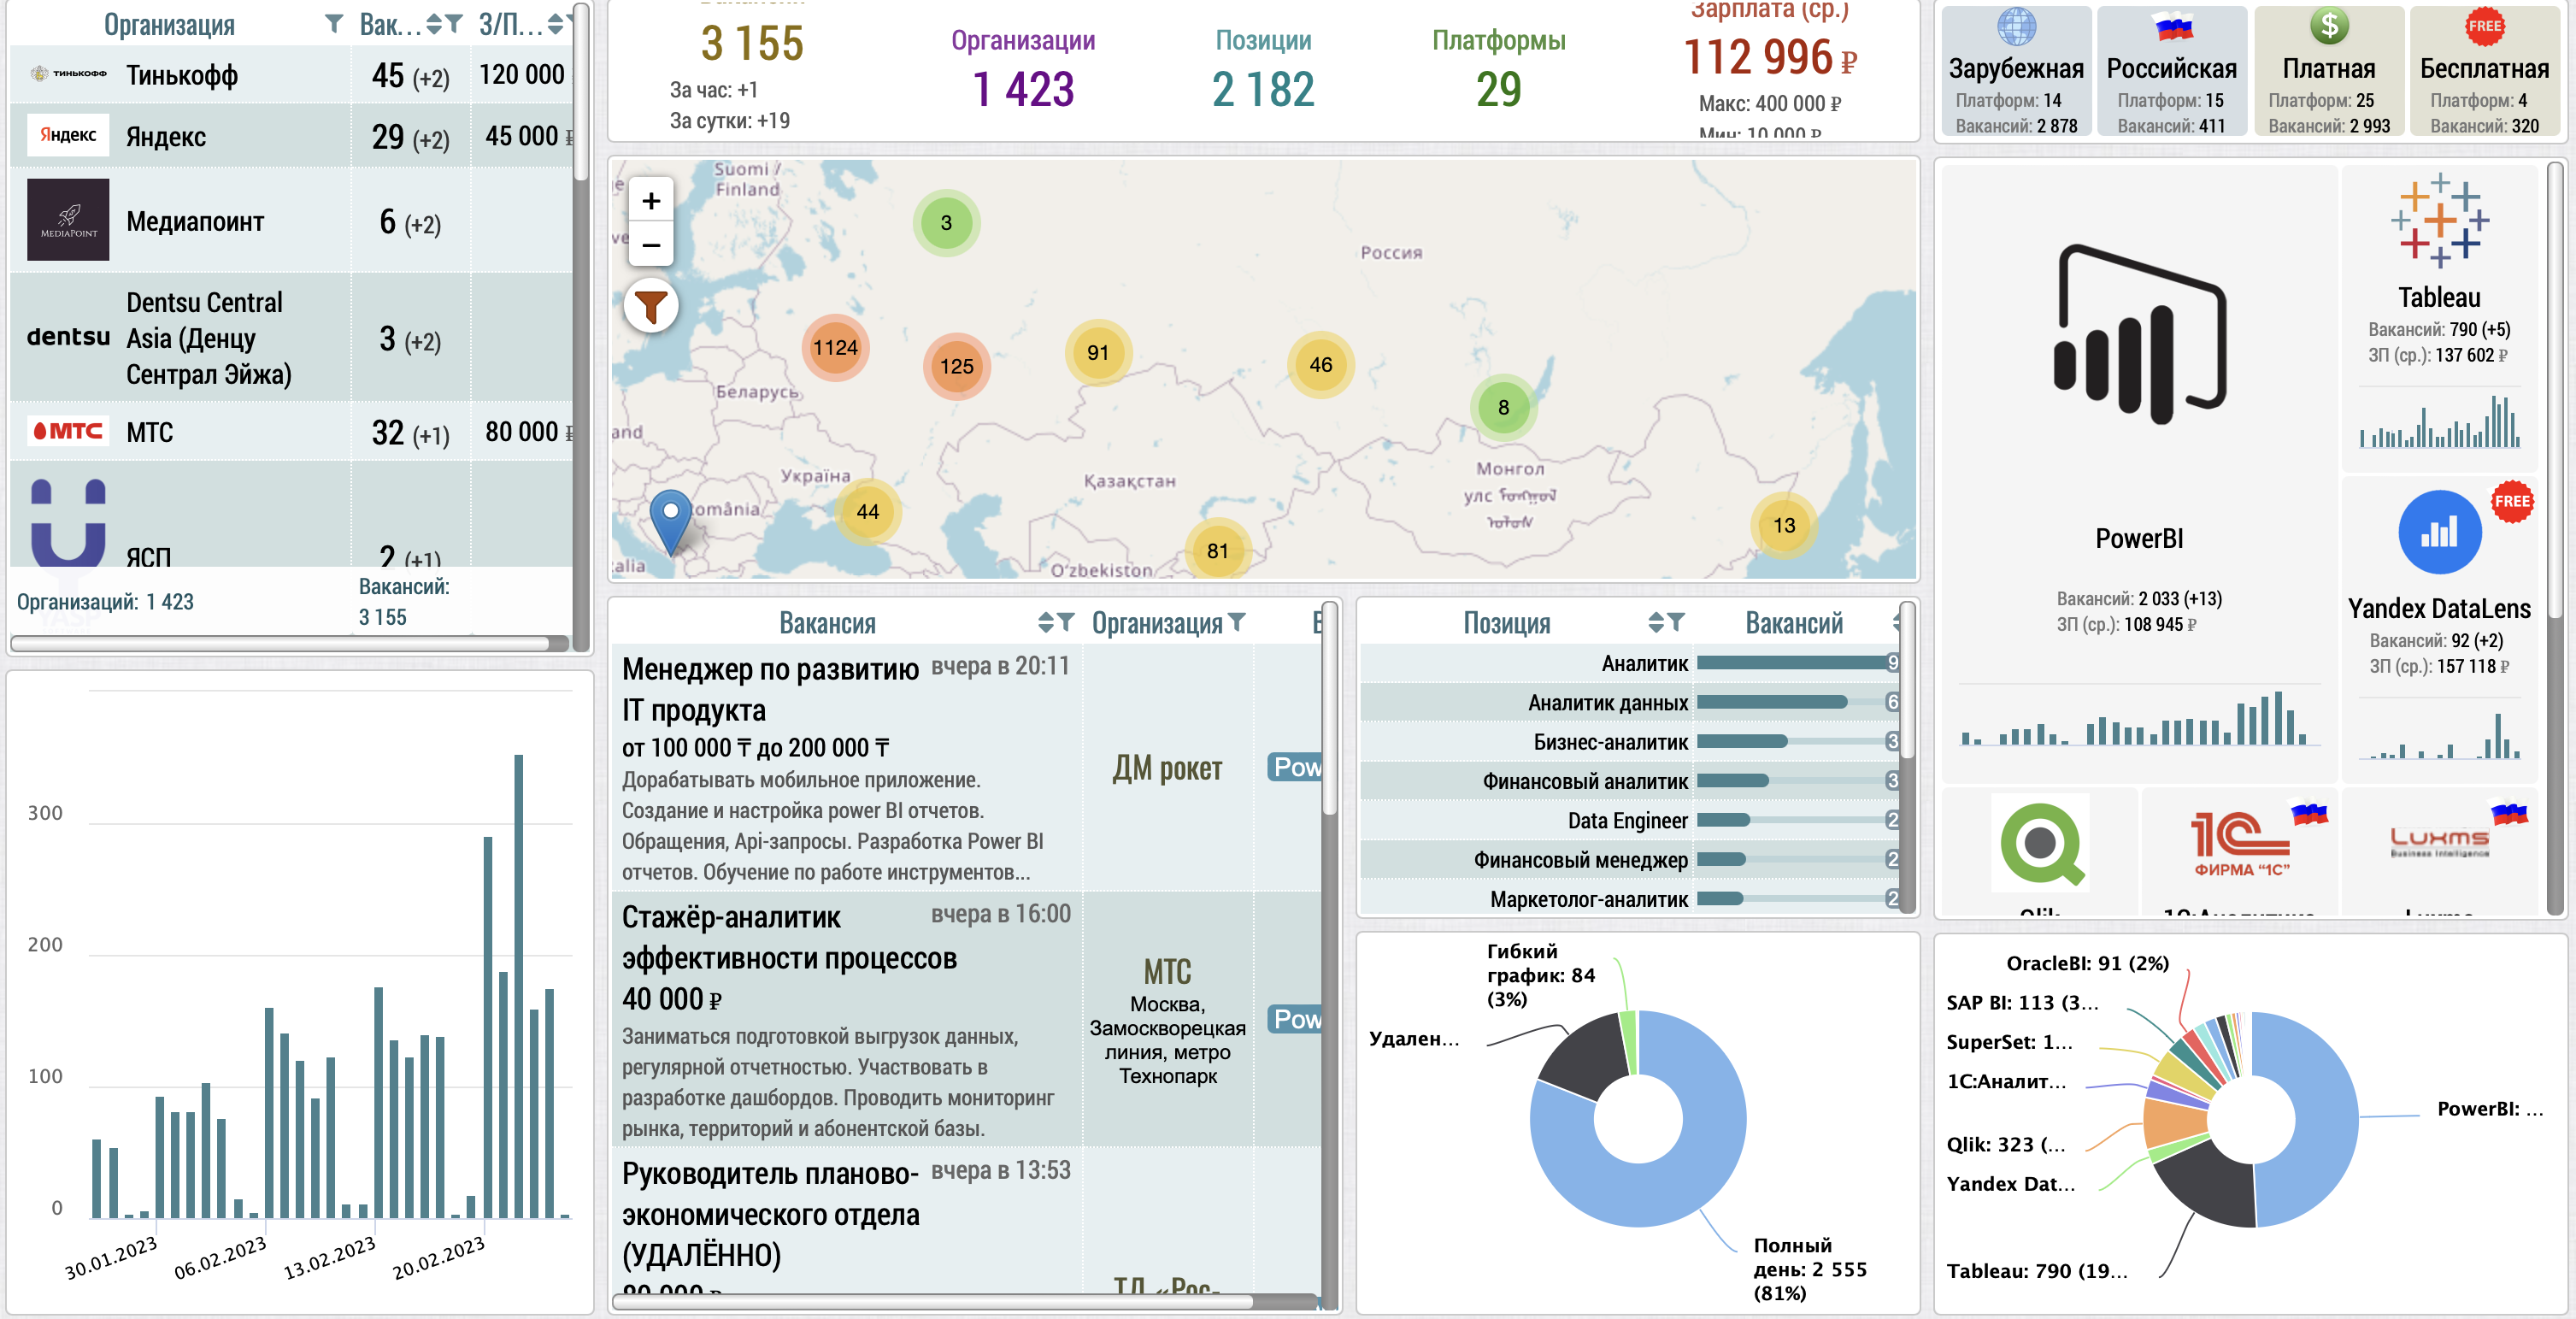
Cultural heritage of the Russian Federation
The showcase-navigator for monuments of history and culture of the Russian Federation
MoreWe will create a custom
dashboard for you
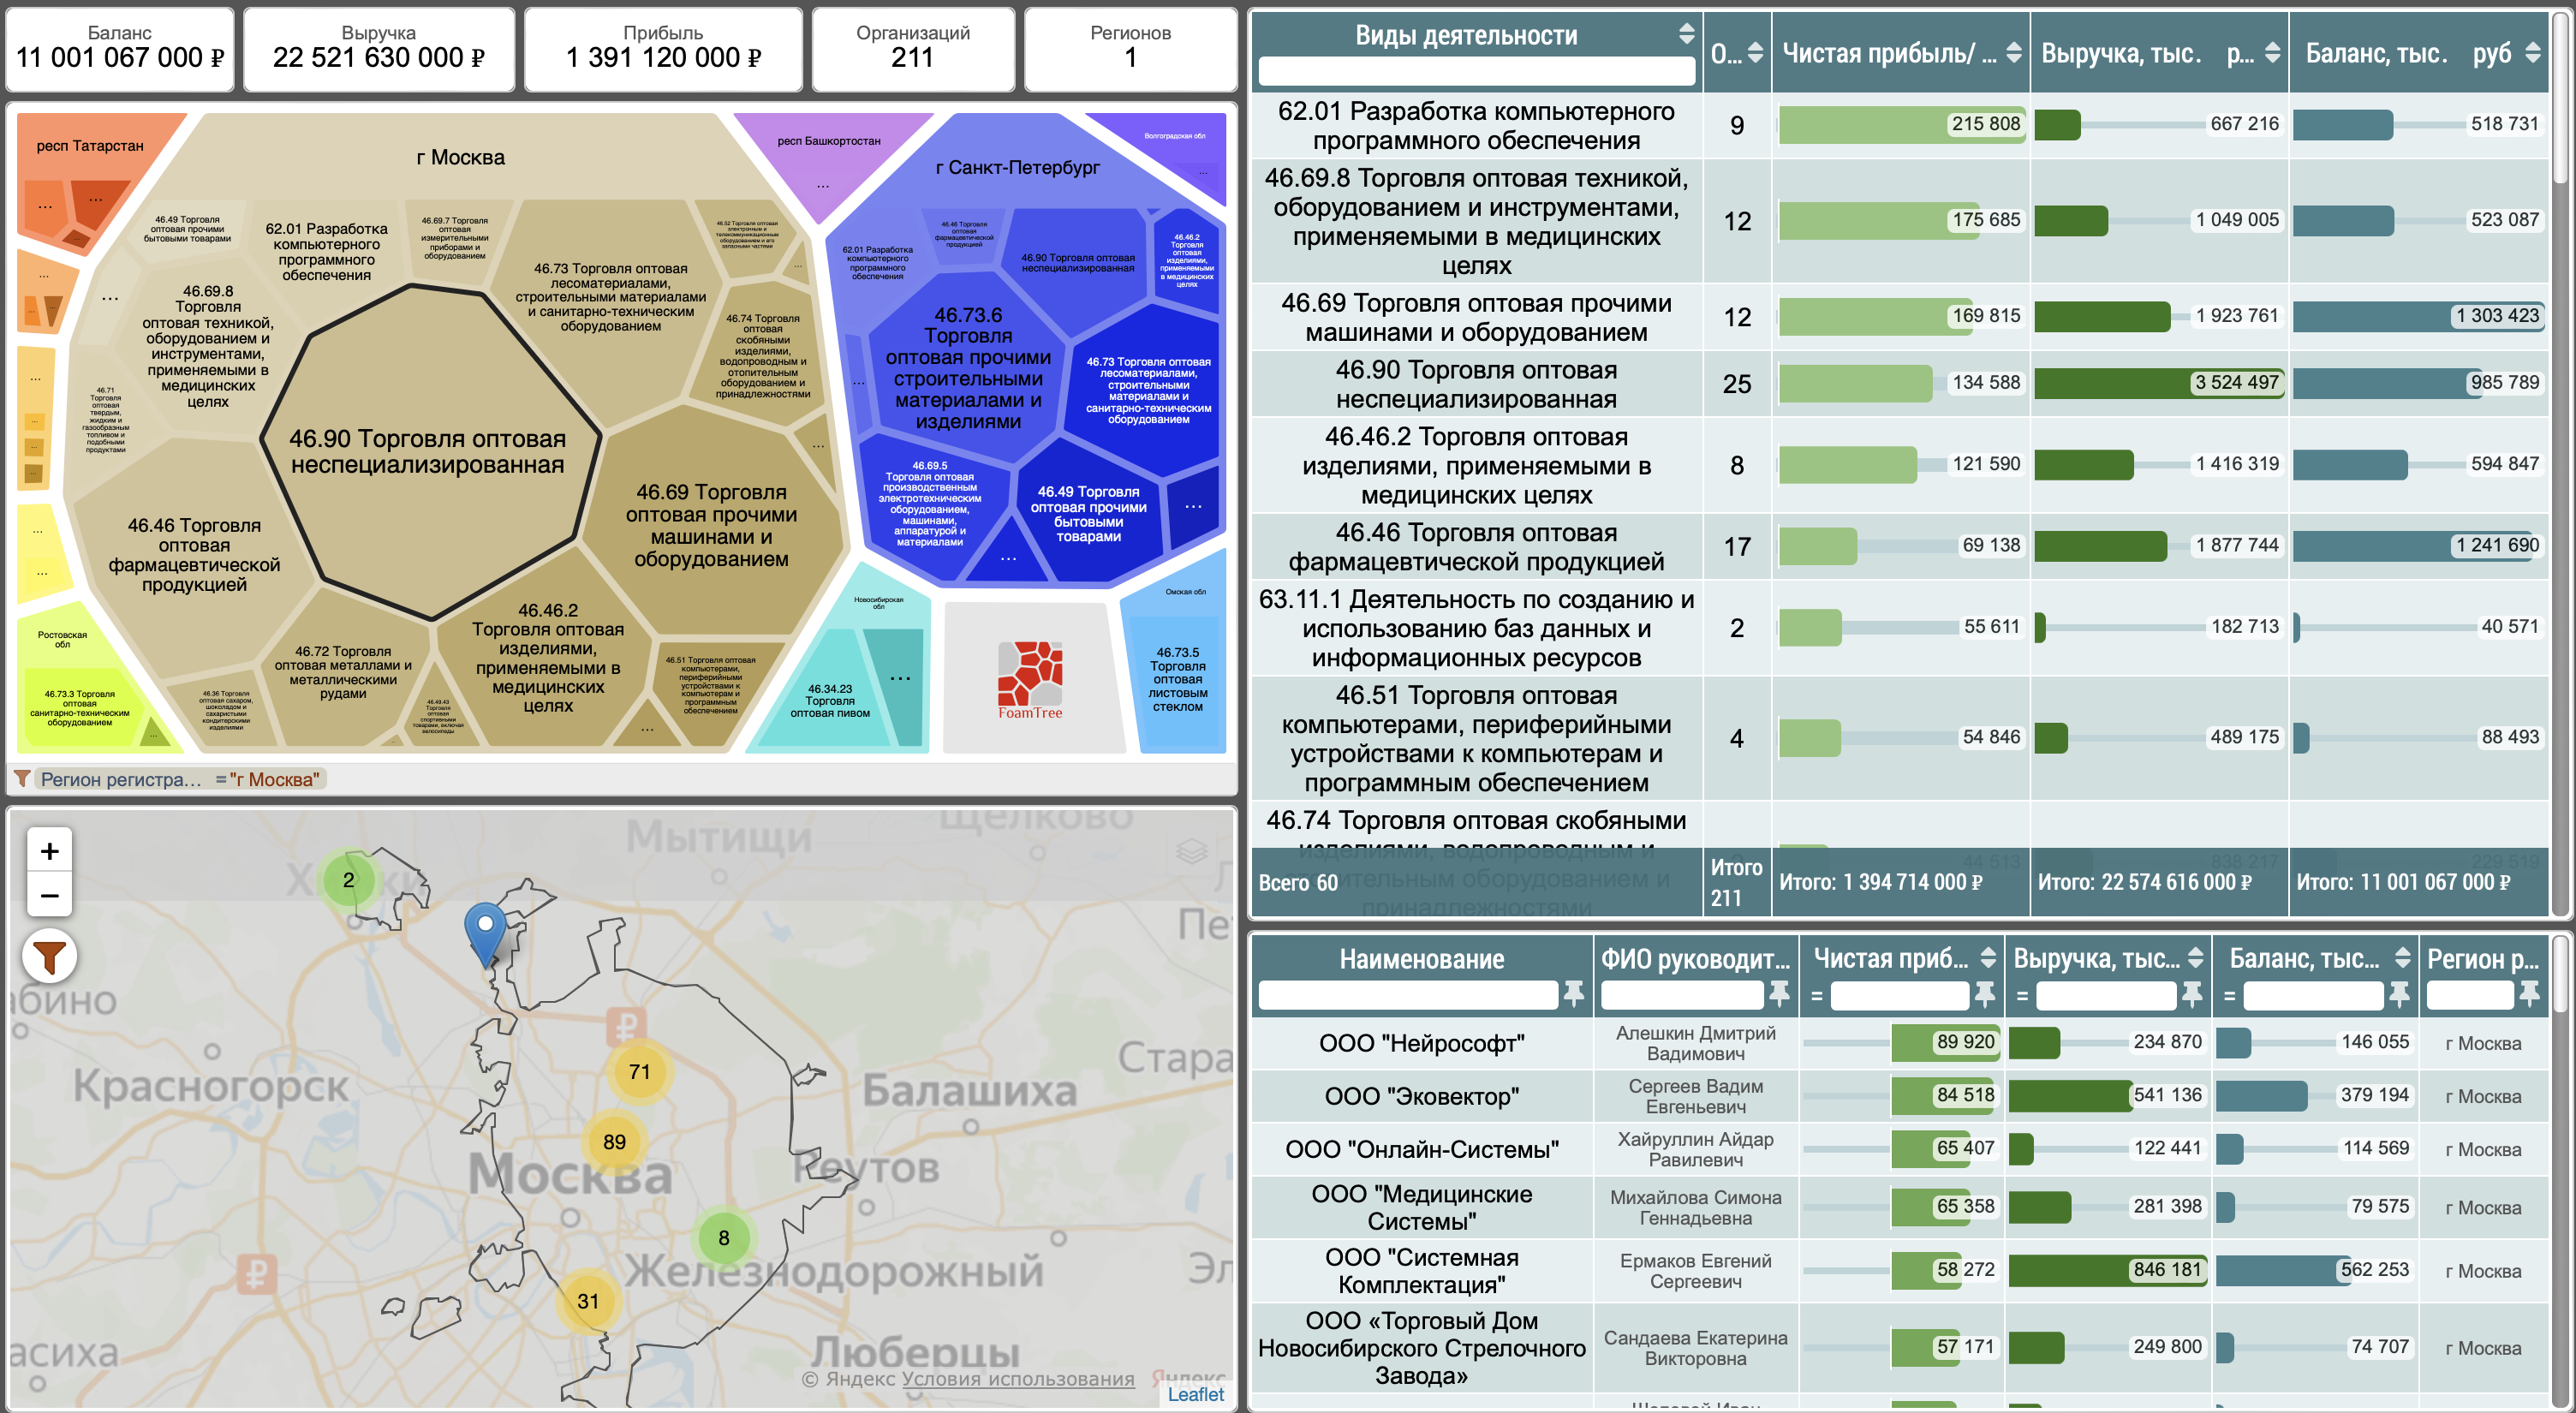
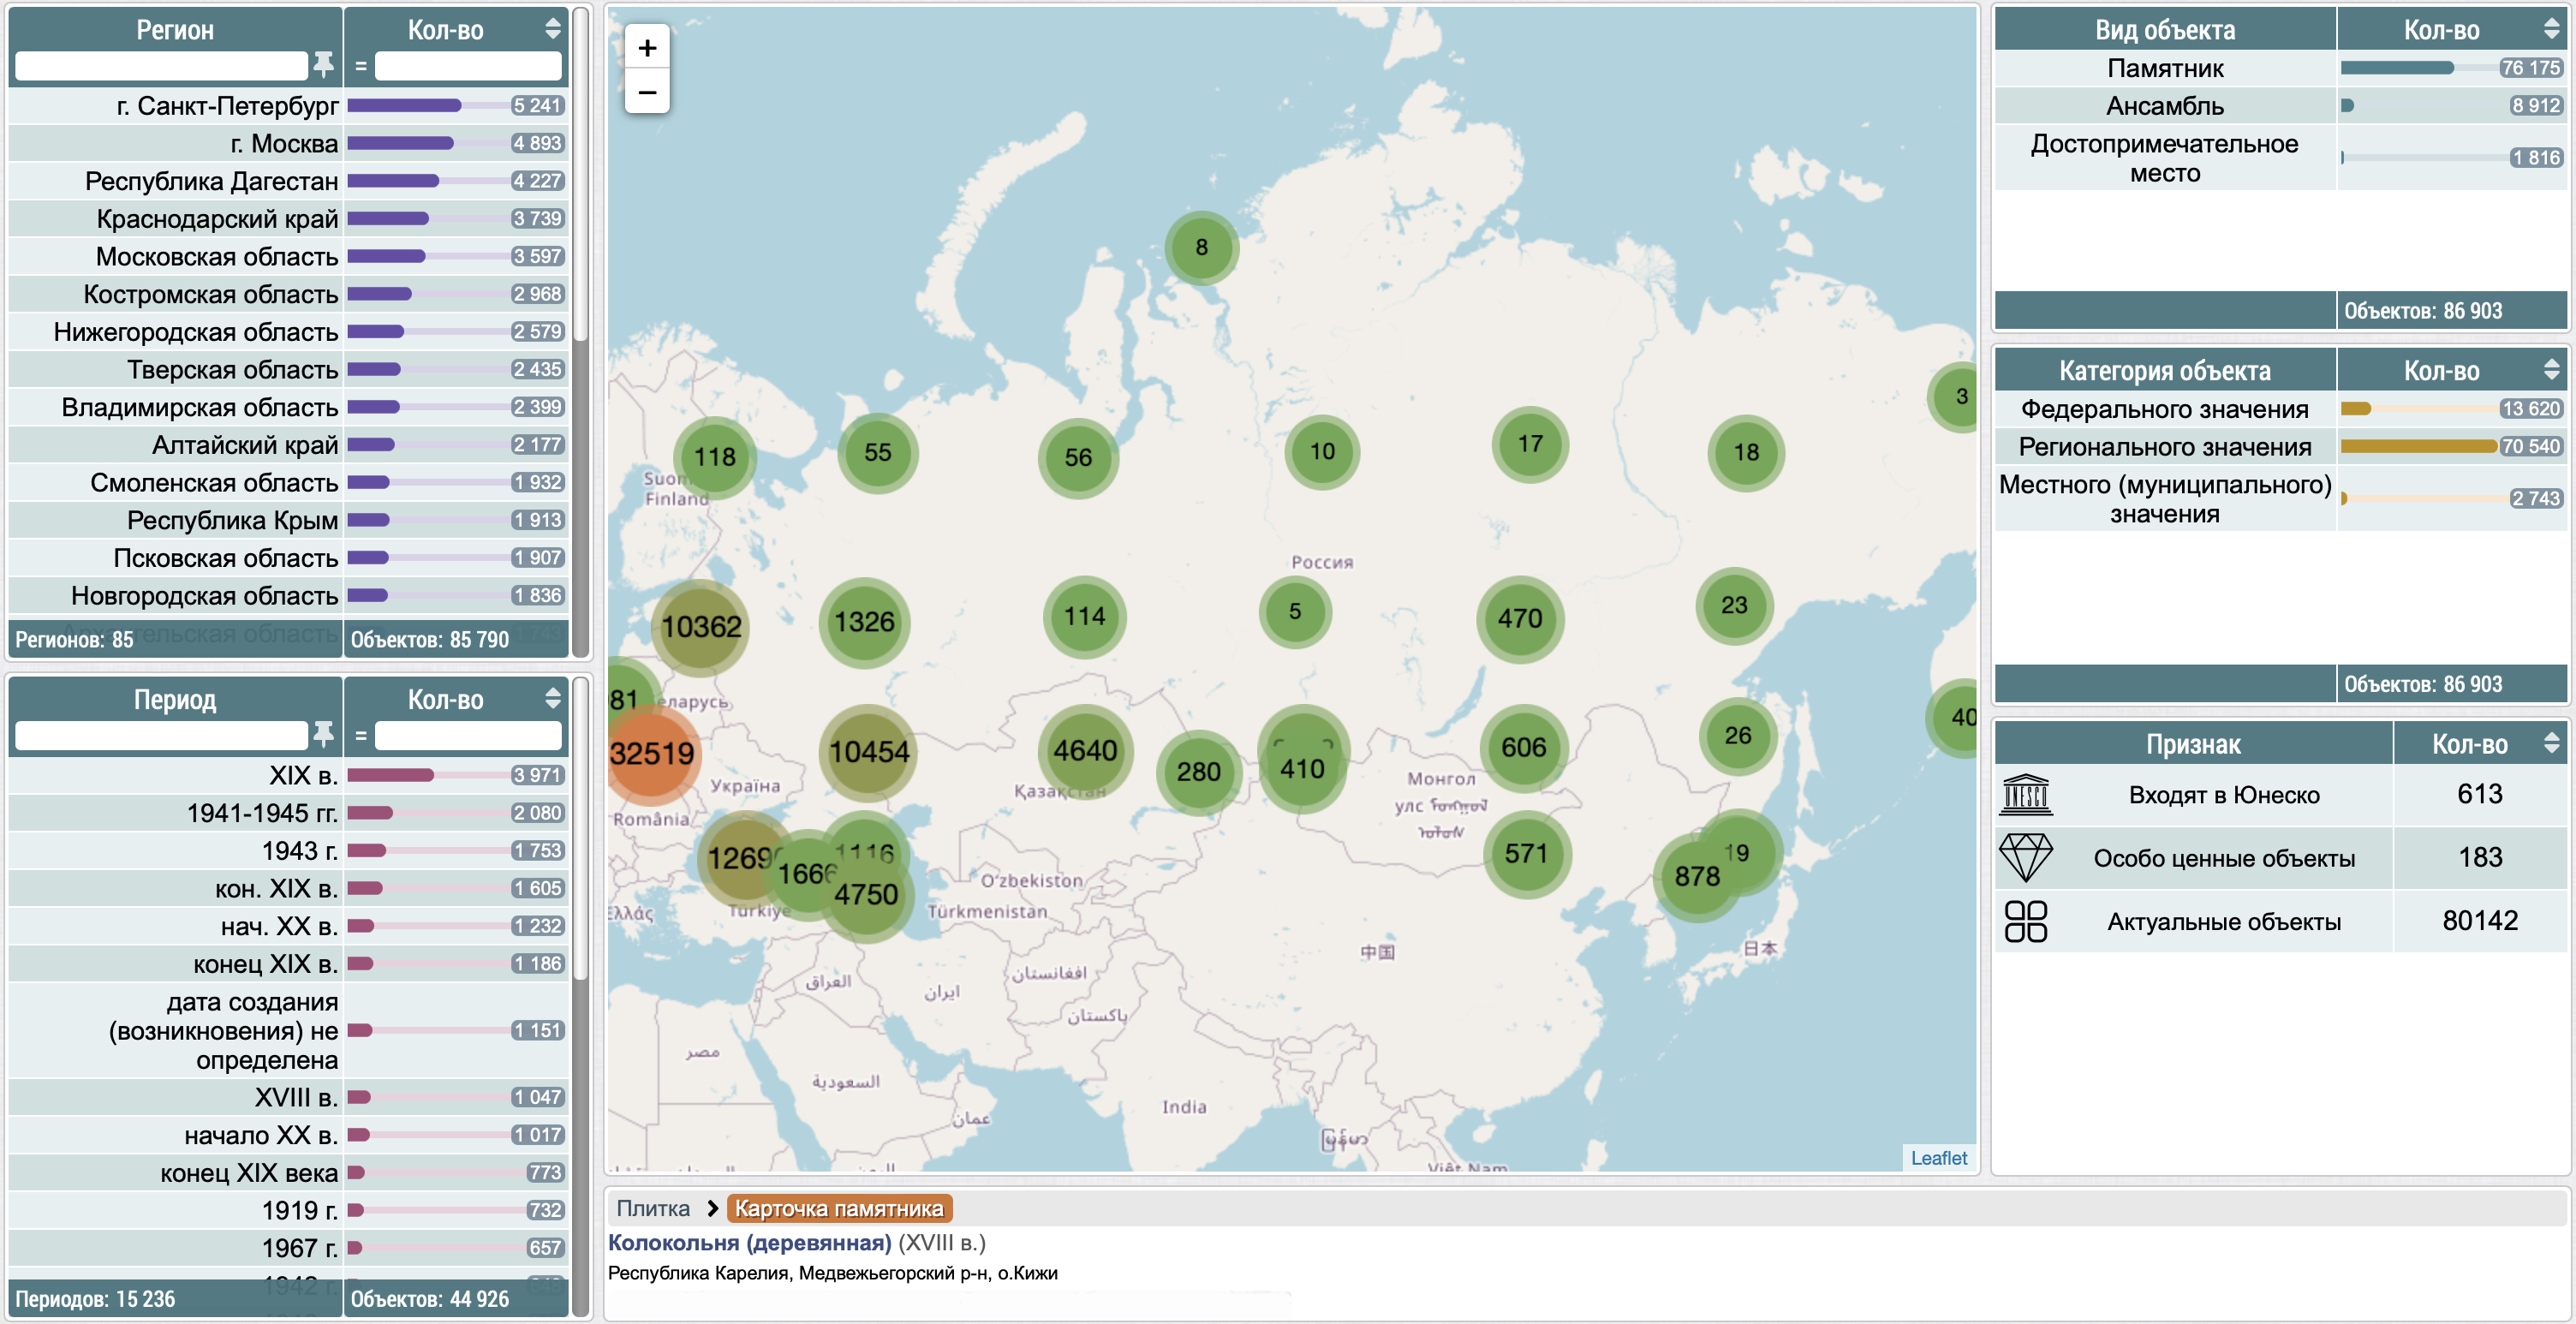
Organizations on the map
An example of visualizing organizations by their financial indicators and geolocation
MoreWant to learn more?
