![]() Cubisio
Cubisio![]()
Data sources
![]() Cubisio
Cubisio![]()
Data sources
![]() Modeling
Modeling ![]()
Formation of data model
A cube is a key element that allows combining multiple sources into a single multidimensional data model.
Construction of the cube
All work on creating a cube occurs exclusively in a graphical editor - adding sources from the workspace to the construction panel, defining a set of fields to be placed in the cube, linking sources and describing dimensions.
Data visualization
The elements of the cube construction can be visualized as a data table at any time.
Query transformation
All analytical queries to the cube go through a series of transformations and are ultimately executed directly on the DBMS side. If any of the connected DBMS does not support the required functions, the cube performs them independently.
Self-contained system
The cube can be used by third-party systems as a standalone component that allows linking heterogeneous sources. It has its own API in the form of a JSON query language and is available through the HTTP protocol.

![]() Modeling
Modeling ![]()
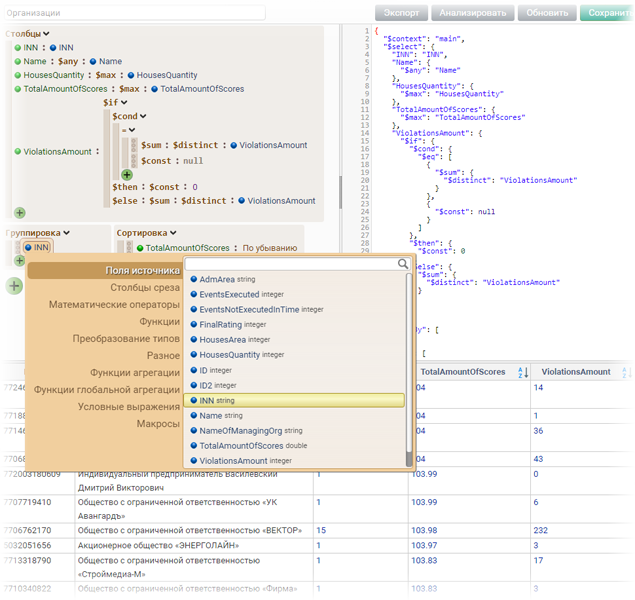
Creation of slices (analysis)
By using slices, the user creates a cube, extracts sets of data from it, calculates additional indicators, and creates new modifications.
Slices
Cubisio offers a graphical editor with a wide range of built-in data transformation functions and mathematical operators for calculating various indicators for constructing slices.
Tables
The process of constructing a slice is accompanied by displaying the results as a data table.
Slice chains
Another slice can be used as a data source for a slice. Thus, slice chains can be generated, with the help of which an analyst can sequentially perform data transformations, adding new calculations to each subsequent slice.
API
Similar to the cube, slices can also be used by third-party systems to extract data through the HTTP API.
![]() Обработка и автоматизация
Обработка и автоматизация ![]()
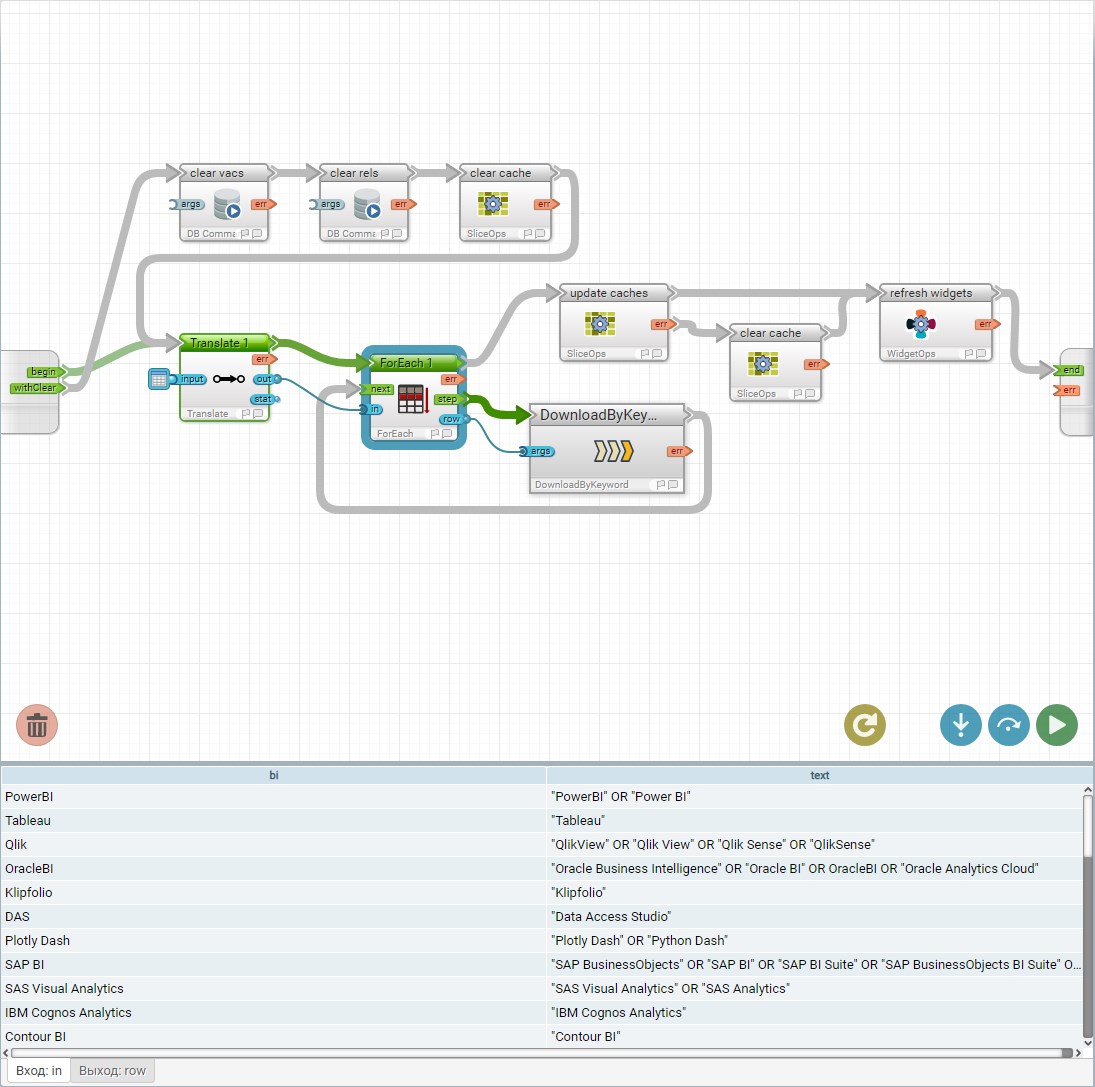
Automation of data processing (ETL)
Cubisio is equipped with a visual constructor of automation schemes for managing the processes of collecting and processing data.
Drag-and-Drop
The construction of the data processing algorithm is carried out by dragging functional blocks from the library to the workspace without the need for coding.
Types of data processing
A wide range of applications for data processing blocks:
Plugins
The library of functional blocks can be easily expanded by connecting plugins with sets of operators covering the required subject area.
Отладка
Analytical processes can also be launched in debug mode and step-by-step execution mode for on-the-fly debugging and improvement of the process.
![]() Моделирование
Моделирование ![]()
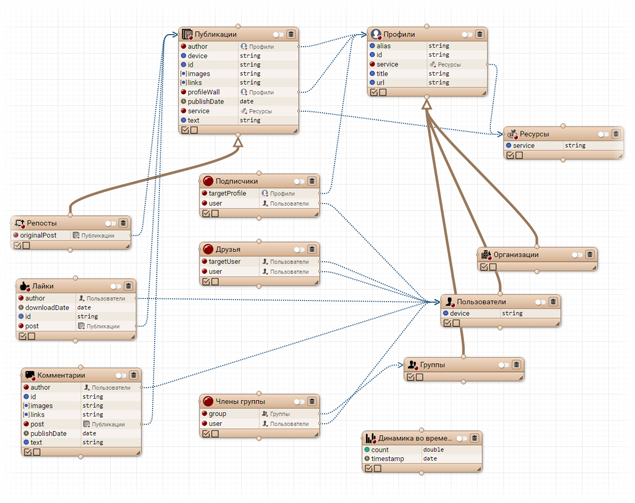
Description of the subject area
Cubisio provides an ontology editor for maintaining directories, classifiers, and modeling related data structures.
Ontologies
The ontology editor allows you to visually (on a diagram) create a set of interrelated concepts (data types) that will help analysts formalize and describe almost any subject area.
Data input forms
For each concept in the ontology, an input form is automatically created, allowing the user to fill it with data (instances). Input forms can be used in dashboards.
Data storages
A corresponding physical representation is created in the DBMS for the ontological model, where all the instance part is stored. Instances of concepts can be used in analytical chains in cubes.
Refinement of ontologies
Ontologies can be extended or refined by other ontologies. This allows linking different subject areas and connecting them to each other.
![]() Data visualization
Data visualization ![]()
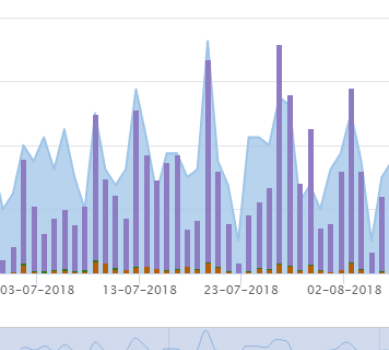
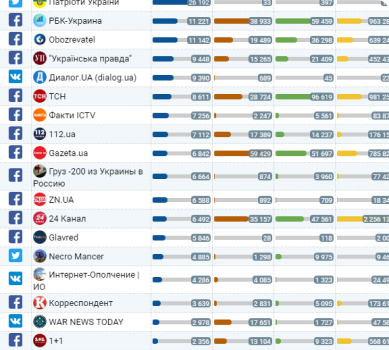
Widgets
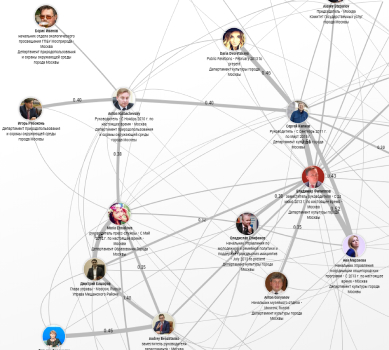
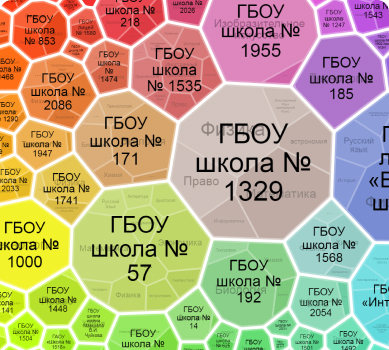
Cubisio offers extensive data and processing results visualization capabilities, including graphs, maps, timelines, interactive drill-down reports with diagrams, charts, and schematics.
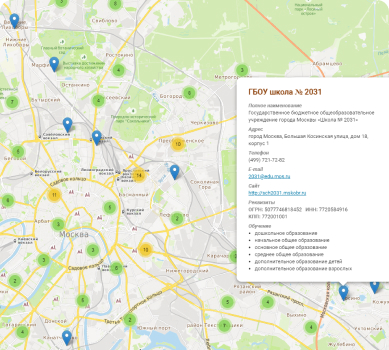
The widgets and presentations are interactive and can dynamically rebuild as data is updated and global and contextual filters are applied. They can be used for information dashboards on video walls in conference rooms or situation centers.
A large set of options in widget settings and the ability to link them to data allow for detailed customization of the appearance and behavior of widgets.
Widgets support multilevel nesting. Examples of this include diagrams nested in table cells, photographs of people in graph nodes, or annotated text in a tooltip on a map.
Widgets, arranged in a presentation, begin to interact with each other. Thus, when a user performs an action on one widget, such as searching or filtering data, the other widgets are immediately updated.
Widgets are alienable and can be seamlessly embedded in third-party web applications while retaining all their qualities and the ability to control them from the application using the API.

Widgets support multilevel nesting. Examples of this include diagrams nested in table cells, photographs of people in graph nodes, or annotated text in a tooltip on a map.
![]() Processing and automation
Processing and automation ![]()
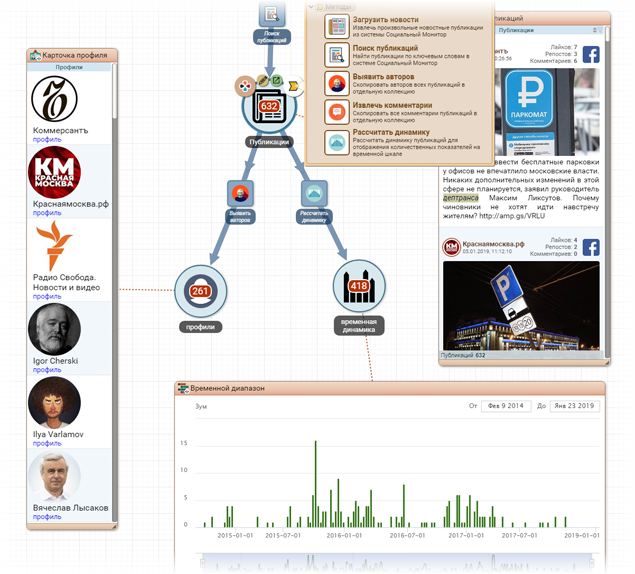
Analytical graph
The analytical graph allows the user to visually investigate data by step-by-step applying transformation operators to them.
Analytical graph
The analytical graph is a diagram where data, ontology entities, operators, and widgets come together. This allows the user to visually create schemes of deep analytical processing, based on the content of the data.
Autonomy
Created schemes can function in autonomous mode, allowing the user to observe real-time changes.
Graphical reuse
The objects used on the graph (data collections, widgets) can be reused in cubes, dashboards, and reports.
Want to learn more?
 Connection to external DBMS
 Import of data from files
 Interaction with web services
 Extraction from open sources